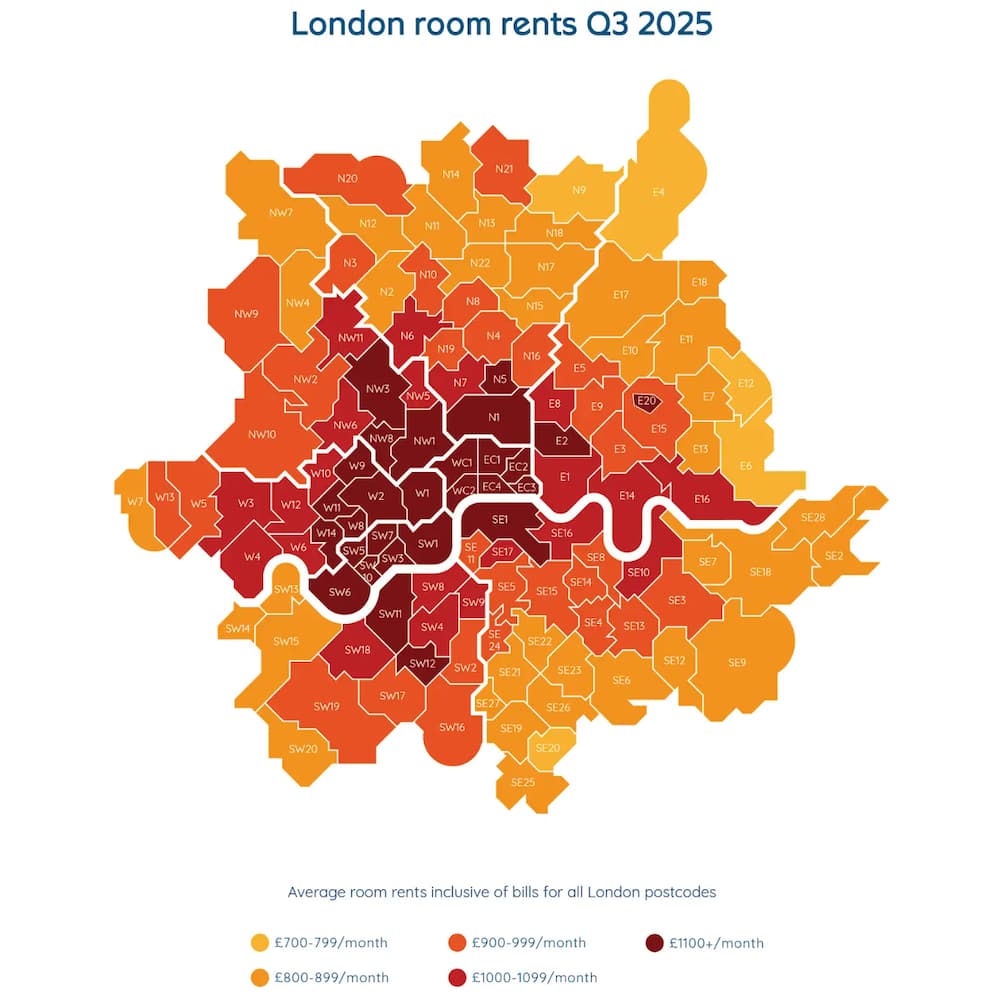
- Renting a room in London now costs £995 per month on average, 37% more than five years ago.
- The capital's average room rent passed the £900 mark in late 2022, peaked in Q4 2023 at £1,015 per month, and is now inching ever closer to £1K again.
- Renters in north London saw the highest year-on-year rent increases (+2.1%) in Q3 2025.
- Those on tight budgets should focus their searches on south east London, where the average rent is £951 per month.
Renting in a shared household is the cheapest way to live in London but, with room rents up 37% in just five years, it's also increasingly unaffordable, reports flatshare site SpareRoom.
The average London room rent rose from £728 per month in Q3 2020 to £995 per month in Q3 2025. Rents first passed £900pm at the end of 2022, peaked at a record high of £1,015pm at the end of 2023 and are now close to £1,000pm once more.
It's still possible to find average rents below £800 per month in E12 (Manor Park), E6 (East Ham), N9 (Lower Edmonton) and E4 (Chingford). By postcode, average rents in E12 have fallen the most (-11%) year on year.
Those on tight budgets should consider searching in the south east of the capital, where the average rent is lowest at £951 per month. But take note that, in Q3, four SE postcodes saw some of the highest year-on-year rent increases in the whole of London: SE3 (Blackheath), SE24 (Herne Hill), SE4 (Brockley), SE9 (Eltham).
North London has seen the highest year-on-year rent increase (+2.1%) in Q3 2025.
SpareRoom has reported rising demand for rooms to rent in commuter areas and suburbia as more flatsharers are priced out of London. Among the areas that have seen some of the steepest year-on-year rent rises in the country are St Albans, just a 20-minute commute to St Pancras, where rents are rising 10% YOY, and Brentwood on the Elizabeth line (+5%).
This table shows how room rents have changed year on year in the eight London postcode areas:
| London regions | Average monthly room rent Q3 2025 | Average monthly room rent Q3 2024 | YOY change |
|---|---|---|---|
| N | £961 | £941 | 2.1% |
| SW | £1,044 | £1,037 | 0.7% |
| SE | £951 | £946 | 0.5% |
| WC | £1,339 | £1,340 | -0.1% |
| W | £1,071 | £1,072 | -0.1% |
| E | £958 | £961 | -0.3% |
| NW | £994 | £1,014 | -1.9% |
| EC | £1,220 | £1,258 | -3.0% |
| London | £995 | £995 | -0.1% |
| UK (excl London) | £670 | £663 | 1.2% |
| UK | £753 | £747 | 0.8% |
This table shows the 10 most and least expensive postcode districts in London:
| Most expensive | Least expensive | ||
|---|---|---|---|
| London postcodes | Ave room rent Q3 2025 | London postcodes | Ave room rent Q3 2025 |
| WC2 (Strand/Holborn) | £1,674 | E12 (Manor Park) | £721 |
| W1 (West End/Soho) | £1,504 | E6 (East Ham) | £759 |
| SW7 (South Kensington/Knightsbridge) | £1,498 | 9 (Lower Edmonton) | £788 |
| W8 (Holland Park) | £1,469 | E4 (Chingford) | £799 |
| SW3 (Chelsea) | £1,355 | SE2 (Abbey Wood) | £804 |
| WC1 (Bloomsbury/High Holborn) | £1,307 | SE12 (Lee) | £808 |
| SW10 (West Brompton/Chelsea) | £1,283 | E10 (Leyton) | £812 |
| W2 (Bayswater/Paddington) | £1,281 | E7 (Forest Gate) | £814 |
| SW1 (Westminster/Belgravia/Pimlico) | £1,268 | N18 (Upper Edmonton) | £818 |
| SW5 (Earl's Court/West Brompton) | £1,258 | N22 (Wood Green) | £820 |
This table shows the 10 postcode districts where rents have risen most year on year:
| London postcodes | Average monthly room rent Q3 2025 | Average monthly room rent Q3 2024 | YOY change |
|---|---|---|---|
| WC2 (Strand / Holborn) | £1,674 | £1,505 | 11.2% |
| SE3 (Blackheath) | £959 | £880 | 8.9% |
| SE24 (Herne Hill) | £971 | £894 | 8.6% |
| SE4 (Brockley) | £911 | £844 | 7.9% |
| E2 (Bethnal Green) | £1,122 | £1,040 | 7.8% |
| SE9 (Eltham) | £851 | £795 | 7.0% |
| SW13 (Barnes) | £985 | £926 | 6.4% |
| N11 (New Southgate) | £876 | £826 | 6.1% |
| N21 (Winchmore Hill) | £904 | £853 | 6.0% |
| W3 (Acton) | £1,000 | £945 | 5.9% |
This table shows the 10 postcode districts where rents have fallen most year on year:
| London postcodes | Average monthly room rent Q3 2025 | Average monthly room rent Q3 2024 | Annual change Q3 2025 vs Q3 2024 |
|---|---|---|---|
| E12 (Manor Park) | £721 | £807 | -10.6% |
| E18 (South Woodford) | £822 | £905 | -9.2% |
| SW7 (South Kensington/Knightsbridge) | £1,498 | £1,634 | -8.3% |
| SE23 (Forest Hill) | £833 | £901 | -7.5% |
| SE17 (Walworth) | £1,046 | £1,127 | -7.2% |
| N9 (Lower Edmonton) | £788 | £839 | -6.1% |
| N2 (East Finchley) | £837 | £887 | -5.6% |
| SW5 (Earl's Court/West Brompton) | £1,258 | £1,332 | -5.5% |
| SE21 (Dulwich) | £850 | £898 | -5.4% |
| W1 (West End/Soho) | £1,504 | £1,589 | -5.4% |
Matt Hutchinson, director at flatshare site SpareRoom, comments: “Because of chronic undersupply in the London rental market, rents are stubbornly high and meeting affordability criteria - not spending more than 30% of your salary on rent - is rarely possible. When even the cheapest room in London is above £700 per month, hardworking people the capital relies on to function have little choice but to leave.”