- London room rents have fallen 1% year on year and now average £982 per month, amid lower demand from renters priced out of the city.
- Rents flatline in NW, SE, SW and WC postcode areas, showing no year-on-year change; E and W London rents have fallen by 2%.
- SW7 (South Kensington and Knightsbridge) is the most expensive postcode in London with average monthly rent now £1,632, while E6 (East Ham) is the cheapest at £775.
New data from SpareRoom's Q1 2025 Rental Index shows London room rents have fallen 1% year on year and now average £982 per month.
Meanwhile, suburban areas are seeing high demand from renters, driven by the relative affordability areas like Epsom, Twickenham and Kingston upon Thames offer. Once popular with growing families, these areas are now sought after by those sharing in the rental market too*.
There are no areas of the city where average rents have increased year on year. Rents have flatlined in NW, SE, SW and WC postcode areas, showing no year-on-year change while E and W London rents have fallen by 2%. But average rents are above £1,000 per month in SW, W, WC and EC postcodes.
Londoners looking for the cheapest rents could focus their searches on East Ham, Lower Edmonton, Manor Park and Chingford - all have average rents below £800 per month.
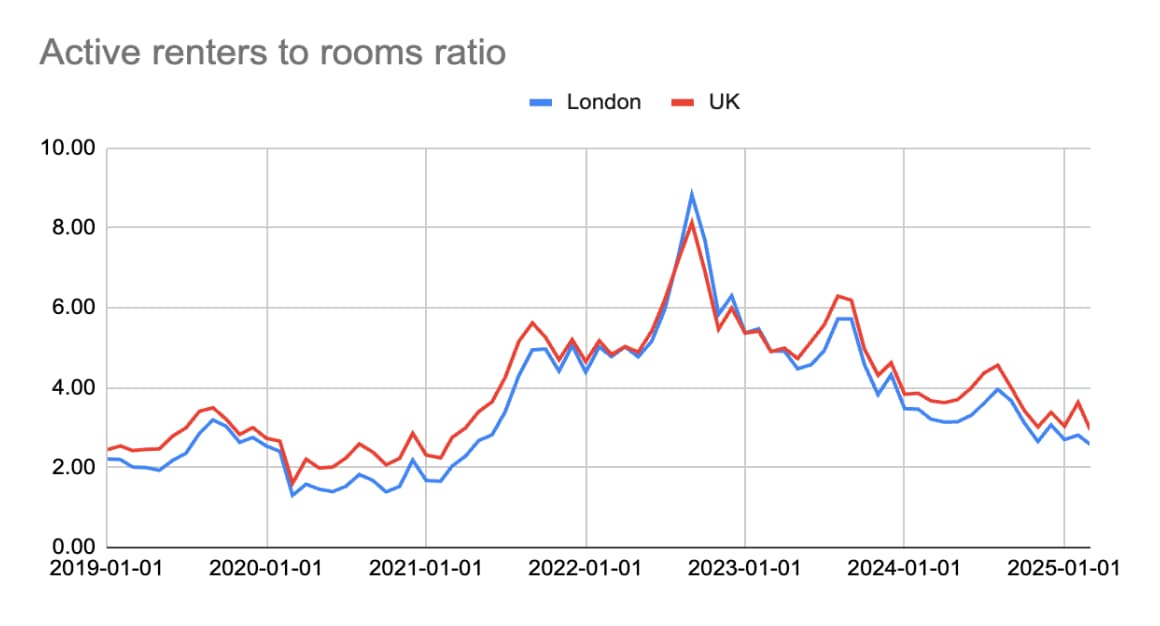
Matt Hutchinson, director at flatshare site SpareRoom, comments:“In London we're seeing rents flatline, and even marginally decrease. The record spike in demand we saw post pandemic - which pushed average rents above £1,000 per month for the first time in 2023 - has finally subsided. But to Londoners struggling to afford the high cost of living in the capital, this won't feel like a relief.
“The long-term view still shows the capital's rental market trending upwards. What we never see are sustained decreases taking rents down to affordable levels. And, while there are more people searching for somewhere to live than rooms available, rents will keep heading north.”
The table below shows London average rents by region and year-on-year change:
| London regions | Average monthly room rent Q1 2025 | Average monthly room rent Q1 2024 | Annual change Q1 2025 vs Q1 2024 |
|---|---|---|---|
| E | £949 | £973 | -2% |
| EC | £1,200 | £1,252 | -4% |
| N | £944 | £957 | -1% |
| NW | £990 | £990 | 0% |
| SE | £945 | £948 | 0% |
| SW | £1,036 | £1,040 | 0% |
| W | £1,035 | £1,055 | -2% |
| WC | £1,302 | £1,297 | 0% |
| London | £982 | £996 | -1% |
| UK | £744 | £739 | 1% |
| UK (excl London) | £662 | £653 | 1% |
Source: SpareRoom.co.uk
The table below shows the most and least expensive London postcodes:
| Most expensive | Least expensive | ||
|---|---|---|---|
| Postcode | Average monthly room rent Q1 2025 | Postcode | Average monthly room rent Q1 2025 |
| SW7 (South Kensington / Knightsbridge) | £1,632 | E6 (East Ham) | £775 |
| SW3 (Chelsea) | £1,468 | N9 (Lower Edmonton) | £778 |
| WC2 (Strand / Holborn) | £1,454 | E12 (Manor Park) | £781 |
| W1 (West End / Soho) | £1,432 | E4 (Chingford) | £785 |
| EC2 (Bishopsgate / Cheapside) | £1,407 | SE2 (Abbey Wood) | £813 |
| W8 (Holland Park) | £1,394 | E7 (Forest Gate) | £813 |
| SW10 (West Brompton / Chelsea) | £1,308 | SE25 (Norwood) | £814 |
| WC1 (Bloomsbury / High Holborn) | £1,279 | SE19 (Crystal Palace) | £820 |
| W2 (Bayswater / Paddington) | £1,271 | N11 (New Southgate) | £822 |
| E20 (Olympic Park) | £1,270 | E11 (Leytonstone) | £824 |
The graph below shows the number of renters per room available over the past five years:
Source: SpareRoom.co.uk