- London room rents have fallen 1% year on year and now average £982 per month, amid lower demand from renters.
- Birmingham rents have fallen for a fourth consecutive quarter to £555 per month, as demand rises in commuter towns outside the UK's second biggest city*
- Regionally, room rents in Northern Ireland and East Anglia have seen the highest year-on-year increases of 5% and 4% respectively.
- But rents in other regions have shown no year-on-year change including East Midlands, North East, Scotland, West Midlands and Yorkshire & Humberside.
- Of the 50 largest towns and cities in the UK, Blackpool has seen the biggest year-on-year increase, up 9%, followed by Southend-on-Sea, up 6%. The biggest faller is Birmingham, where rents dropped by 4%.
New data from SpareRoom's Q1 2025 Rental Index shows London room rents have fallen 1% year on year and now average £982 per month. Meanwhile, suburban areas are seeing high demand from renters*, driven by the relative affordability of areas like Epsom, Twickenham and Kingston upon Thames. Once popular among growing families, these areas are now sought after by those sharing in the rental market too.
It's a similar story in Birmingham, the UK's second largest city. Out of the 50 largest UK towns and cities, it's the biggest faller. Rents have dropped 4% year on year, amid high demand for rooms in commuter towns, including Smethwick and Solihull.
Regionally, London is the only area to have seen an annual decrease (-1% YOY), but rents in other regions have shown no change, including East Midlands, North East, Scotland, West Midlands and Yorkshire & Humberside. Meanwhile, rents in Northern Ireland and East Anglia have seen the highest year-on-year rent increases of 5% and 4% respectively.
Of the UK's 50 largest towns and cities, Blackpool has seen the biggest year-on-year increase in rents, up 9%, followed by Southend-on-Sea, up 6%. Ipswich, Newcastle and Oxford have all seen 5% increases. Meanwhile, Bolton, Bradford, Edinburgh, Nottingham have all seen rents fall by 3% year on year.
Outside London, renters in Kingston upon Thames pay the most expensive average rent at £926 per month, while those in Bootle pay the least at £462 per month.
Matt Hutchinson, director at flatshare site SpareRoom, comments: “In major cities like London and Birmingham, rents have flatlined, and even marginally decreased, as the record spike in demand we saw post pandemic finally subsides. Essentially, these cities have become too expensive and people who have the option to work remotely can live where commutes are longer but rents are cheaper.
"But zoom out and view the rental market over years, not months, and it's still trending upwards. What we never see are sustained decreases taking rents down to affordable levels. Rents go up, then flatline at the new level for a while. They never seem to come down by much. Wage increases have never kept pace with rent rises, or the spiralling cost of living, so the affordability gap gets ever wider. While there are more people searching for somewhere to live than rooms available, rents will keep heading north.”
UK average room rents by region and year-on-year change:
| UK region | Average monthly room rent Q1 2025 | Average monthly room rent Q1 2024 | Annual change Q1 2025 vs Q1 2024 |
|---|---|---|---|
| East Anglia | £678 | £653 | 4% |
| East Midlands | £564 | £563 | 0% |
| North East | £546 | £547 | 0% |
| North West | £606 | £597 | 2% |
| Northern Ireland | £564 | £537 | 5% |
| Scotland | £675 | £679 | 0% |
| South East | £745 | £735 | 1% |
| South West | £666 | £651 | 2% |
| Wales | £583 | £579 | 1% |
| West Midlands | £563 | £564 | 0% |
| Yorkshire & Humberside | £557 | £557 | 0% |
| London | £982 | £996 | -1% |
| UK | £744 | £739 | 1% |
| UK (excl London) | £662 | £653 | 1% |
Source: SpareRoom.co.uk
UK's most/least expensive towns/cities:
| UK's most expensive towns/cities | UK's least expensive towns/cities | ||
|---|---|---|---|
| Town/City | Average monthly room rent Q1 2025 | Town/City | Average monthly room rent Q1 2025 |
| Kingston upon Thames | £926 | Bootle | £462 |
| Twickenham | £914 | Bradford | £466 |
| Barnet | £865 | Burnley | £468 |
| Epsom | £839 | Grimsby | £473 |
| St. Albans | £838 | Middlesbrough | £473 |
| Oxford | £834 | Blackburn | £480 |
| Croydon | £829 | Huddersfield | £481 |
| Harrow | £826 | Rotherham | £486 |
| Bromley | £814 | Barnsley | £489 |
| Enfield | £807 | Hartlepool | £492 |
Source: SpareRoom.co.uk
The graph below shows the number of renters per room available over the past five years:
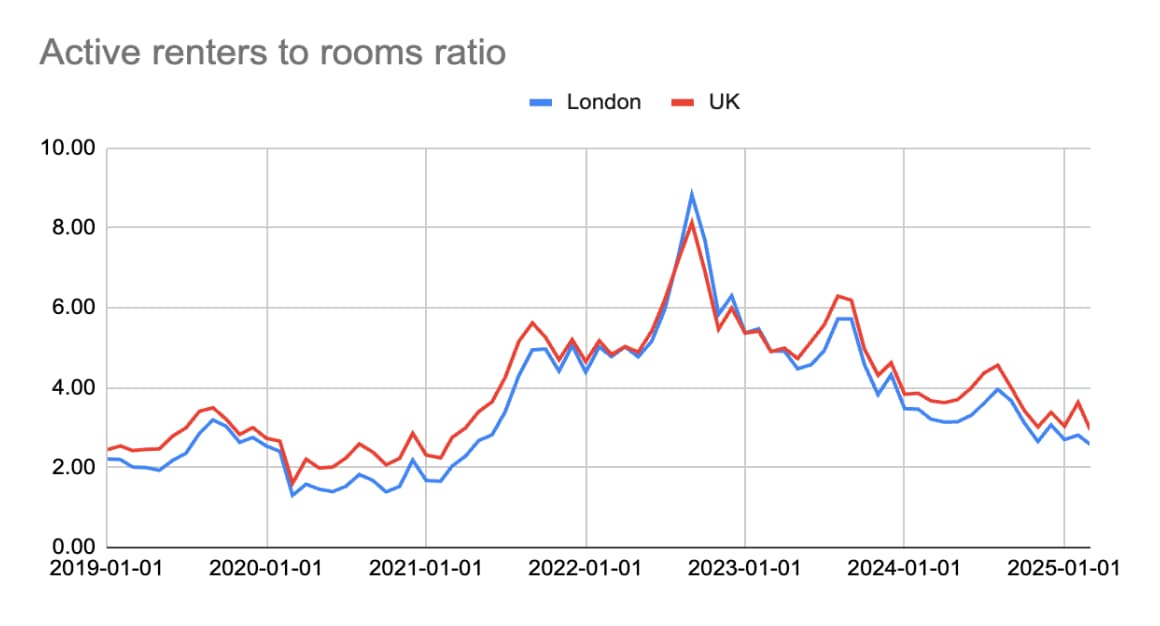
Source: SpareRoom.co.uk