In July, the ratio of active renters searching compared to rooms available in the UK was 5.6, compared to 6.2 in July 2022. In London it was 4.9, compared to 6 at the same point last year.
Demand (and rents) still increasing but supply higher than in 2022
SpareRoom's latest Quarterly Rental Index shows rents are still rising in London and across the UK.
But we don't just look at the stats on a quarterly basis - we also do a separate set of monthly analyses, and this month's data sheds some light on the nuance of what's happening right now in the rental market.
Monthly vs annual changes
July 2023 vs June 2023
- The number of active renters in the UK rose by 14.2% in July
- The number in London rose by 14.5%
- Live room ads rose by 6.3% in London and 5.5% across the UK
- Average rents rose again to another all time high, both in London and across the UK
Looking at that in isolation, demand is outstripping supply again, so not much has changed. However, summer is always a busy time and we'd expect the numbers to climb month on month. Year on year gives a more accurate comparison.
July 2023 vs July 2022
- The number of active renters in London fell by 0.2%
- The number across the UK, however, rose by 7.5%
- The number of live room ads in London was up by 20.8%
- The number across the UK was up by 19.5%
The real test is to look at the ratio of people looking vs rooms available, as the actual number of either only tells one side of the story.
Active renters vs live room ads
- The number of active renters searching, compared to rooms available in the UK in July was 5.6 - down from 6.2 in July 2022
- In London it was 4.9 - down from 6 in July 2022
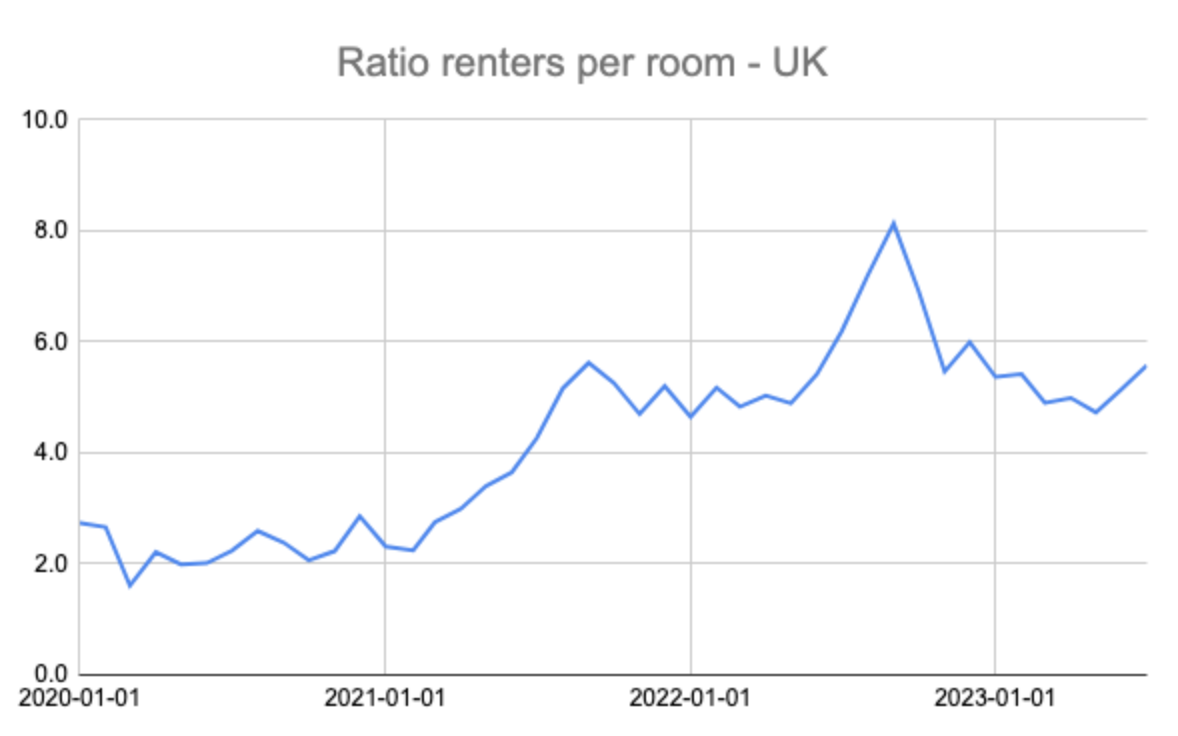
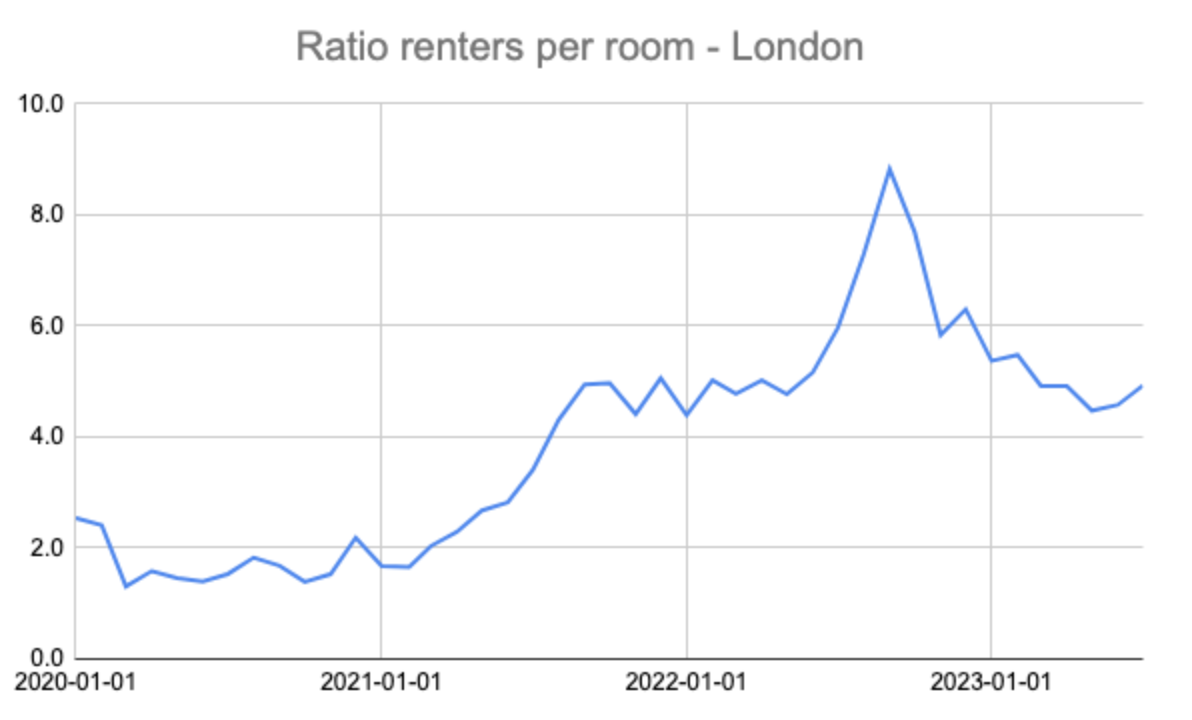
At the worst of the imbalance last year, those numbers went up to 8.8 in London and 8.1 in the UK as a whole (both in September). We're currently below that, although nowhere near the averages of around 2 we'd expect historically.
How we calculate demand vs supply
The number of active renters per room isn't the same as the number of applicants per room.
As an example, if there are 100 rooms available and 200 people looking, that's a renters to rooms ratio of 2:1. However, it's possible that all 200 of those people might message one of the ads, leading that person to believe there are 200 people going for every room. That's a little misleading, so we look at active renters per room to get a real sense of what's happening.
In summary
Things are hotting up again, as they always do at this time of year, but they're starting from a (slightly) more balanced place than they were in July 2022.
We know from surveying tenants that lots of people are simply staying put to avoid rent increases. Maybe that's affecting things, or maybe (as the London stats suggest), people are just giving up on living in London because it's too expensive.
The next couple of months will be interesting to say the least.